Development of SRP educational infographics
While only approximately 1 inch long, zebrafish are remarkably similar to humans. Understandably, their size and appearance may cause doubt about how much information they can give us about human health impacts of chemical exposures. To help explain the use of zebrafish and other unique research tools within our Superfund Research Program, we developed two educational infographics for public distribution.
The use of zebrafish in research
The field of toxicology is moving toward less reliance on animal studies with an increased emphasis on the development of alternative methods for assessing chemical toxicity. The OSU-PNNL Superfund Research Program employs several innovative tools which help us do just that. One such tool is the use of the zebrafish as a model organism. This tool provides robust, high-throughput data for multiple endpoints. However, linking zebrafish assays to environmental and public health can be challenging for many. To help explain the use of zebrafish and other research tools within our Superfund Research Program, we developed two educational infographics for public distribution.
Why did we decide to make these infographics?
Early in 2020, I had the opportunity to attend a meeting of the Portland Harbor Community Coalition in Portland, Oregon to discuss concerns related to environmental health and chemical contamination at Portland Harbor. The meeting was incredibly useful for me to gauge the community’s concerns and their level of understanding of the methods we apply at our Center to address chemical hazards. The participants were very interested in learning more about our research and when I had the chance to briefly explain the use of zebrafish in toxicology, I found myself wishing I had a concise educational tool or document I could provide them along with my commentary. I wanted to help explain why and how we utilize the model without derailing the very important conversations we were having.
Our Center has a Research Translation component, which has worked with the Oregon Health Authority and other collaborators to develop infographics. The Coalition has used several of our infographics previously, and was very engaged and helpful for refining and improving the infographics. Through this process, I recognized a few key factors that can help make infographics and educational tools as impactful as possible:
- Concise, easy to understand language
- Simple and recognizable icons
- Logical flow of information (read from top to bottom, left to right, etc.)
- Mindfulness of inclusion of all community members
This encounter left me with many ideas of what information our Center could provide the community and how to be more effective when sharing our science with a general audience.
Infographic development and design process
Not long after this meeting, our Research Translation co-Coordinator, Dr. Diana Rohlman, proposed the idea of creating an infographic about the use of zebrafish in toxicology. The timing was perfect! As we discussed what should be included, we quickly realized there was much more information about zebrafish and chemical hazard assessment than could be contained in one infographic. Ultimately, we decided to develop two infographics: 1) a general outline of tools our Center uses to assess chemical hazards and 2) the specific role of zebrafish as a model for toxicology research. We decided to present the information to a general, community audience with plain language that would be accessible across reading levels.
After we decided on our primary topics, we identified our key points for each. What central message are we trying to get across? How important are technical details versus big-picture questions we want to address as a Center?
Then came the fun part – the art! We workshopped quite a bit on the design of each infographic, producing several drafts of each until we were happy with the general flow and aesthetics. We then consulted with a group of OSU researchers to gather their opinions and suggestions. Once again, having more eyes on the graphics was invaluable! This process helped us better understand the effectiveness of our messaging and improved the aesthetics of our infographics.
Infographic 1 – How can we predict Chemical Hazards?
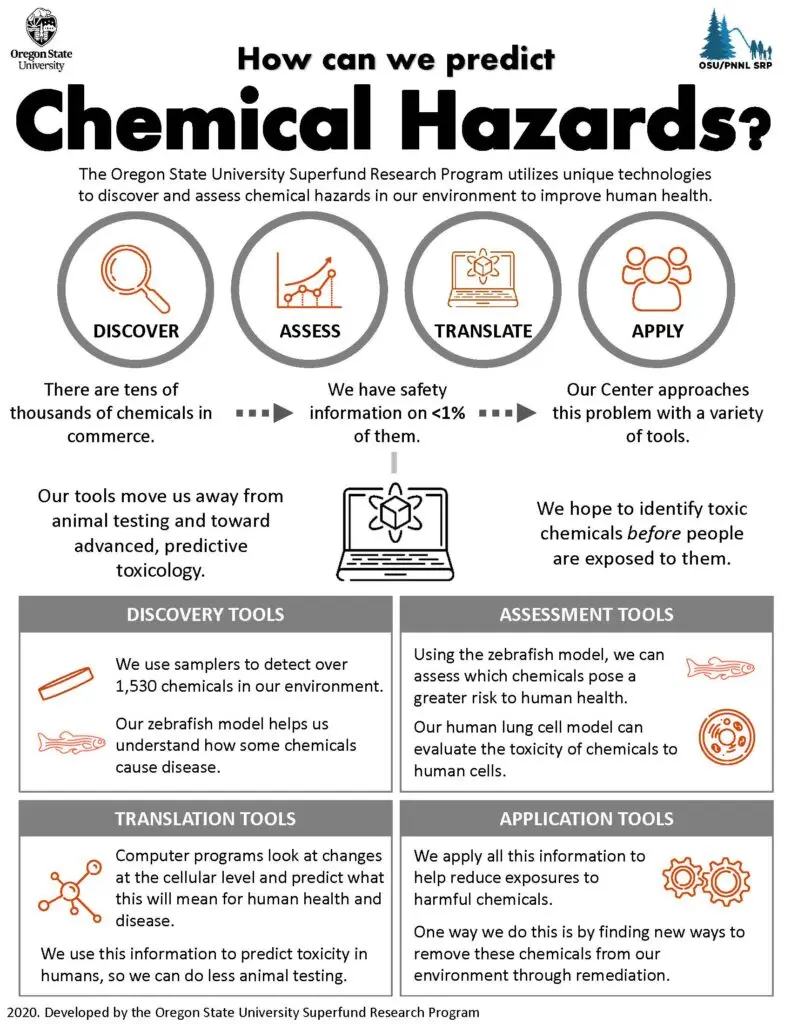
When developing this infographic, we wanted to highlight the four pillars of our SRP center: Discover, Assess, Translate, and Apply (DATA, for short) and the tools we use for each of these. We also wanted to emphasize that the tools developed and used by our Center are meant to address a central problem: chemical safety information is seriously lacking for most of the chemical universe and we strive to close this gap.
Infographic 2 – The Zebrafish as a Research Tool
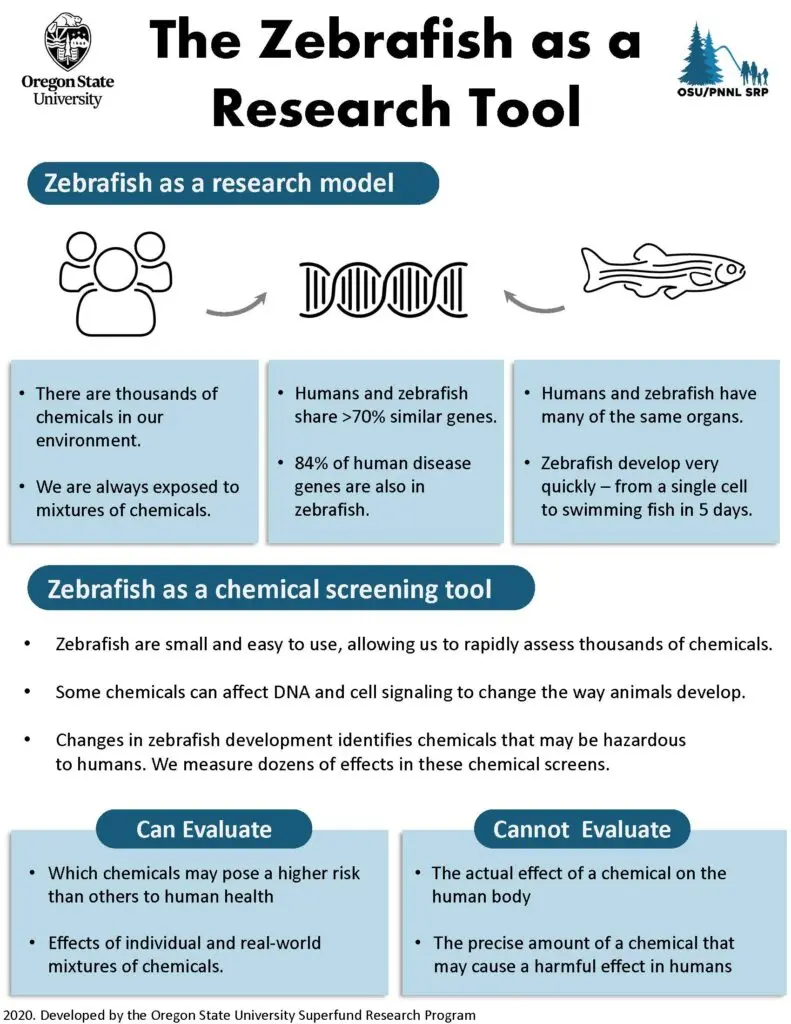
For this infographic, we wanted to highlight two key concepts: 1) Zebrafish are genetically and physiologically similar to humans and 2) zebrafish are uniquely useful for screening chemicals for toxicity. It was also important for us to be very clear about what information we can and cannot glean from zebrafish studies. Generally, we wanted to get the point across that zebrafish have much of the same cellular “machinery” as humans, therefore, chemicals that affect that machinery in zebrafish can also cause effects in humans, even though we look very different.
Future direction – engagement with younger audiences:
One of my favorite parts of being a student and SRP trainee at OSU is the many opportunities to engage with youth (K-12) through outreach events. In these events, it is important to us that we not only provide a fun experience for students, but to also educate them in digestible and engaging ways. We decided to make an additional infographic explaining the similarities between zebrafish and humans for younger audiences to supplement in-person and virtual activities. Be on the lookout for that soon!
Ultimately, the process of developing these infographics has helped me better understand how to communicate science more effectively across audiences. I believe scientists are in a unique position to share our research, not only via scientific publications, but via other, less formal, methods of community engagement.